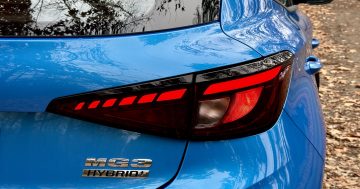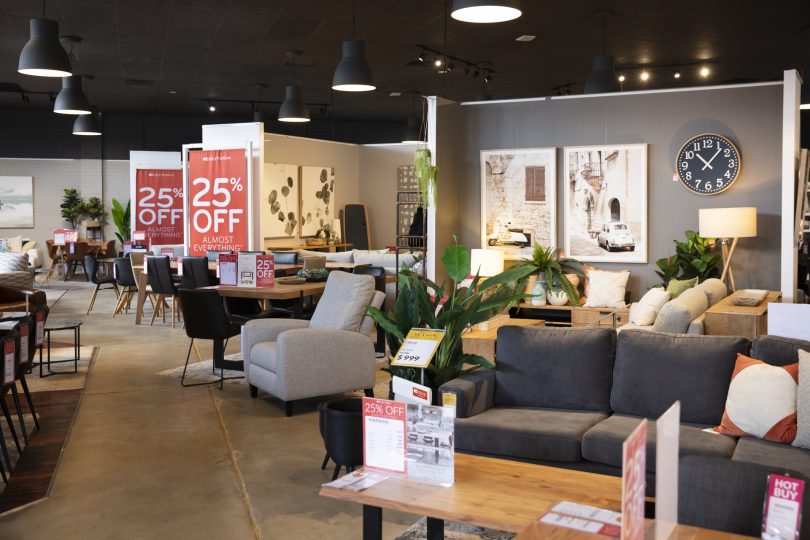
The demand for furniture is leading strong household spending figures, according to the latest ABS data. Photo: Thomas Lucraft.
Household spending is up across Australia, with the latest figures showing a 6.3 per cent overall jump from a year ago.
Furnishings and household equipment (particularly whitegoods), clothing and footwear, and recreation and culture have led the spending growth over the past few months.
The Australian Bureau of Statistics has released household spending figures for November 2025, adding to those of the previous two months.
The latest figures do not yet include December’s Christmas shopping data.
Household spending rose 1 per cent in November, according to the ABS’s seasonally adjusted figures.
This follows rises of 1.4 per cent in October and 0.4 per cent in September, making household spending now 6.3 per cent higher than the same time the previous year.
ABS head of business statistics Tom Lay said major concerts and sporting events, as well as widespread discount sales, had contributed to the healthy spend.
“Household spending remained strong in November, continuing the strong rises in services and goods spending seen in October,” he said.
“Services spending rose by 1.2 per cent, driven by major events, including concerts and sporting fixtures.
“These events are linked to higher spending on catering, transport, and recreation and cultural activities.
“Growth in goods spending, which lifted 0.9 per cent, was driven by Black Friday sales [with] clothing, footwear, furnishings, and electronics seeing the biggest gains as consumers took advantage of widespread discounts.”
Growth in household spending was broad, seeing a consistent jump in eight of the nine categories listed by the ABS.
Interestingly, spending on alcohol and tobacco had an almost 0.2 per cent drop in November, following a similar percentage rise in October.
While reasons are not stipulated for that, the rise in illegal tobacco sales could be a contributing factor to the drop in official sales data.
The nine categories measured are food; alcoholic beverages and tobacco; clothing and footwear; furnishings and household equipment; health; transport; recreation and culture; hotels, cafes and restaurants; and miscellaneous.
The biggest rise in November was in furnishings and household equipment, up 2.2 per cent.
This was followed by clothing and footwear, which rose 2 per cent, with recreation and culture up 1.7 per cent.
In annual terms, miscellaneous goods and services (+10.6 per cent) and recreation and culture (+8.6 per cent) had the largest growth rates in the 12 months to November.
Services spending was 7.8 per cent higher than in November 2024, while goods spending was up 4.9 per cent compared with a year ago.
Household spending grew in all eight states and territories, but was led by Tasmania, up 2.1 per cent, and Western Australia, 1.7 per cent higher.
The ACT had a decent 1.5 per cent bounce in October (higher than all states except NSW and Queensland), following a 2.3 per cent drop in September, which was the biggest drop recorded in September across all jurisdictions.
Household spending in the ACT then rose 0.9 per cent in November, according to the seasonally adjusted figures.
Spending in the ACT on food was up 0.1 per cent in November, while alcohol and tobacco spending was down 1.1 per cent in the territory.
Clothing and footwear spending in the ACT was up 2.7 per cent in November, with furnishing and household equipment also up, 1.5 per cent.
Spending on health in the ACT dropped 1.3 per cent in November, with a similar fall recorded for miscellaneous goods spending.
Transport spending was up 2.2 per cent in the ACT for November; recreation and culture +2.6 per cent; and hotels, cafes and restaurants +0.8 per cent.
The household spending indicator is produced for all states and territories using aggregated and de-identified card transactions from banks, supermarket scanner data, and motor vehicle sales data from the Federal Chamber of Automotive Industries and Electric Vehicle Council.
Original Article published by Chris Johnson on Region Canberra.